













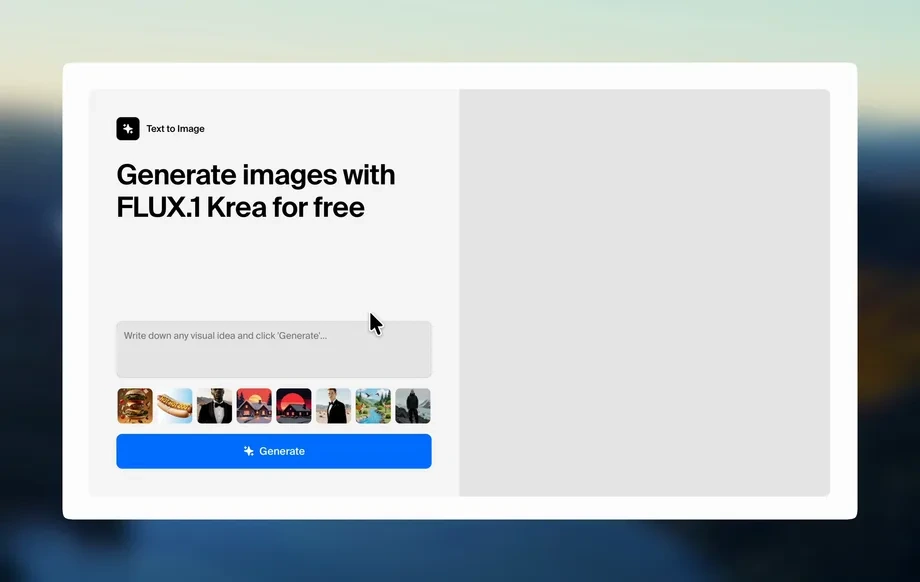
Step 1
Add inputs
Enter the project location and upload a Google Earth screenshot. Ensure the view clearly shows the area of interest for accurate wind rose diagram context.
Generate a wind rose analysis diagram from a location and Google Earth screenshot. Fast AI visualization for planning, design, and reporting. Try it now.
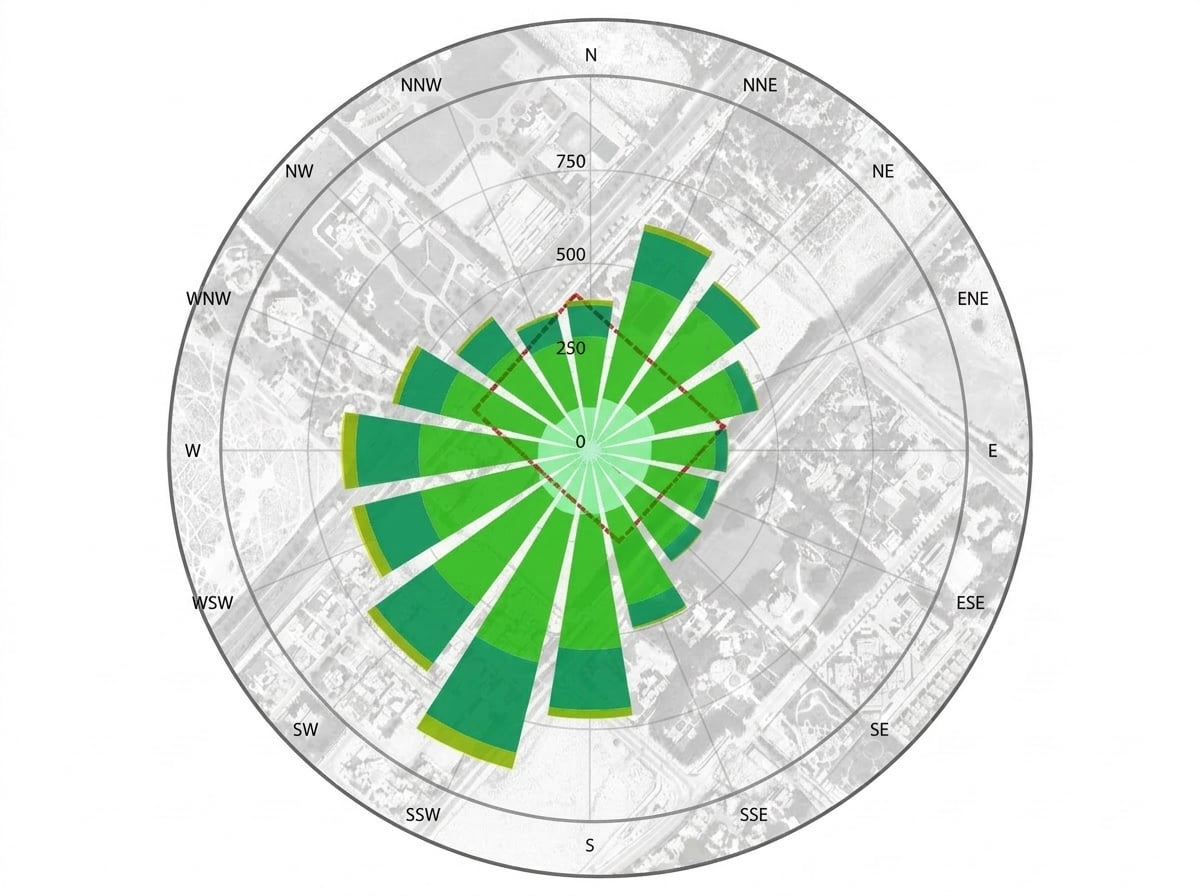
How to use XA_Wind Rose Analysis Diagram
This quick workflow helps you generate a wind rose analysis diagram using two inputs: a location and a Google Earth screenshot. Follow the steps to upload, analyze, and export a diagram ready for planning and reports.
Step 1
Enter the project location and upload a Google Earth screenshot. Ensure the view clearly shows the area of interest for accurate wind rose diagram context.
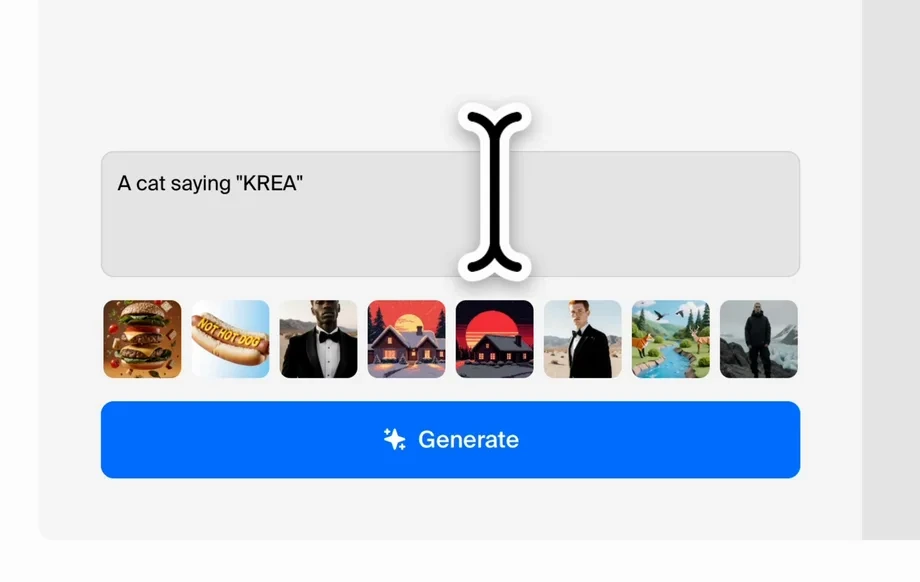
Step 2
Start the AI wind rose analysis to process the location and screenshot together. Review the generated wind direction and frequency visualization for quick validation.
Step 3
Download the wind rose analysis diagram for use in planning decks, environmental notes, or design documentation. Re-run with new screenshots to compare scenarios.
Features
Generate a wind rose analysis diagram from a specified location and a Google Earth screenshot. The tool quickly visualizes wind direction distribution and relative frequency, helping you make informed site and orientation decisions. Produce consistent, shareable outputs for early-stage studies, design reviews, and reporting without complex setup.
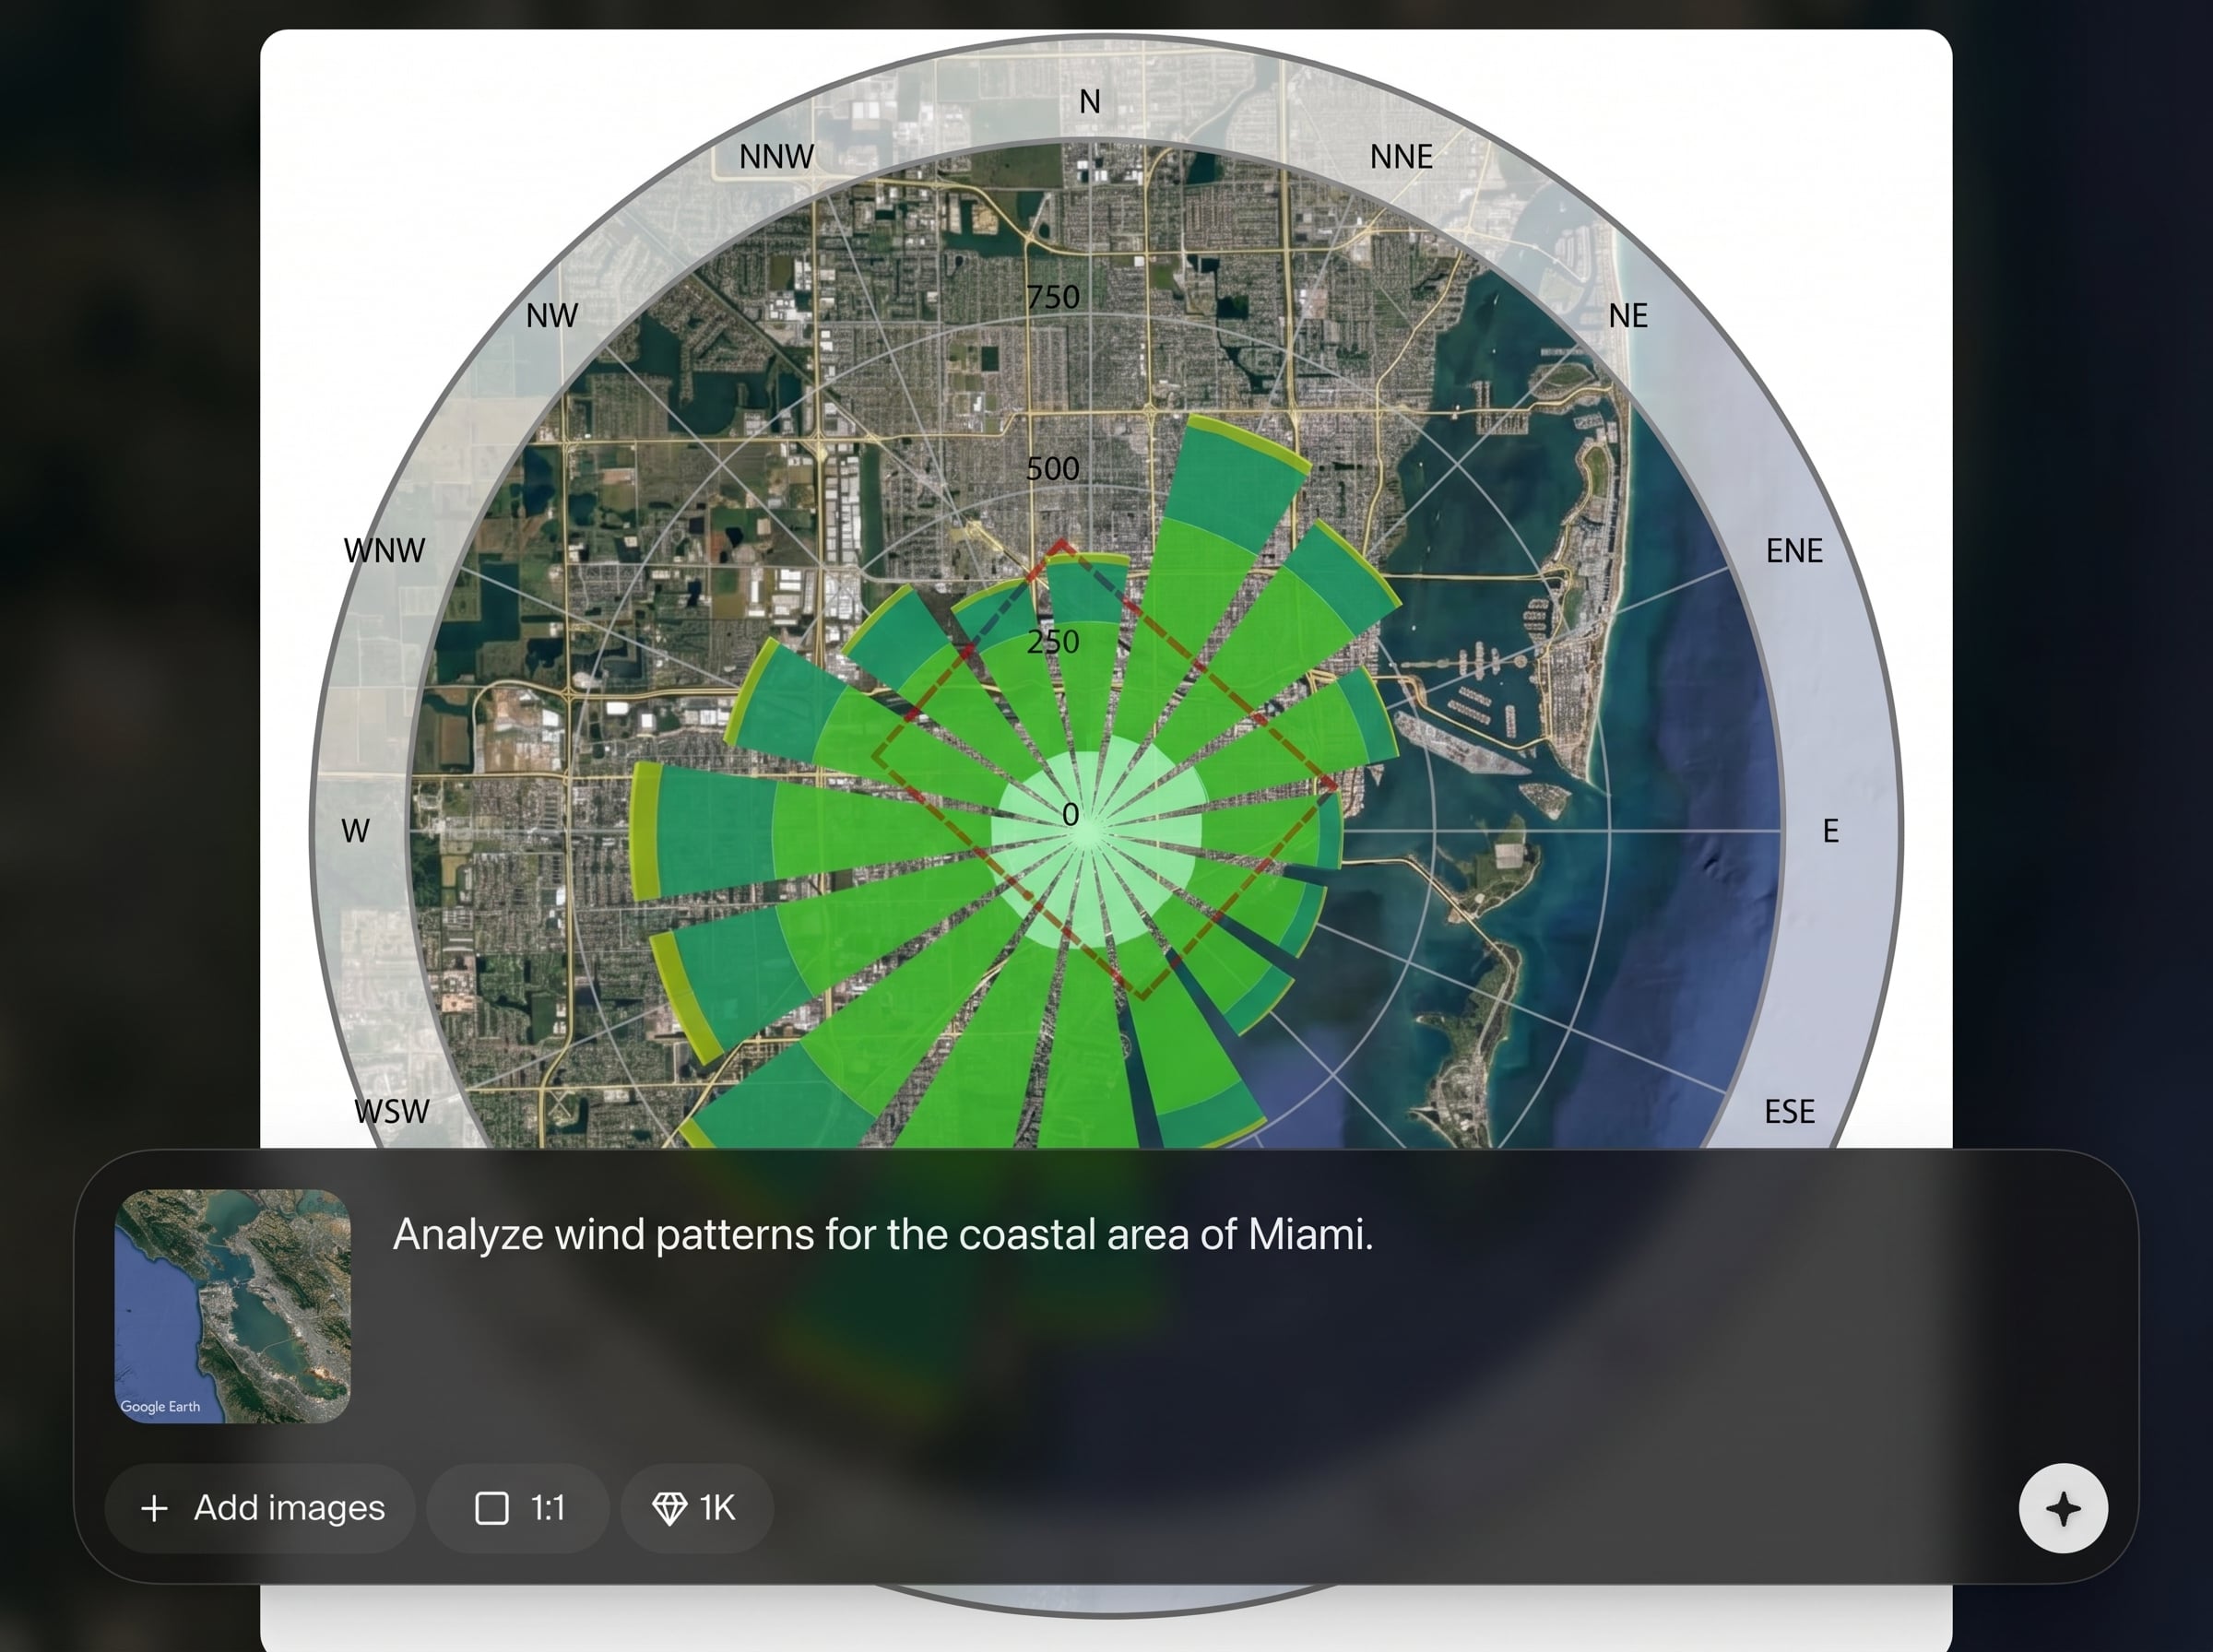
Create a wind rose diagram tied to a specific site location, so results are easy to interpret for orientation, massing, and outdoor comfort considerations.
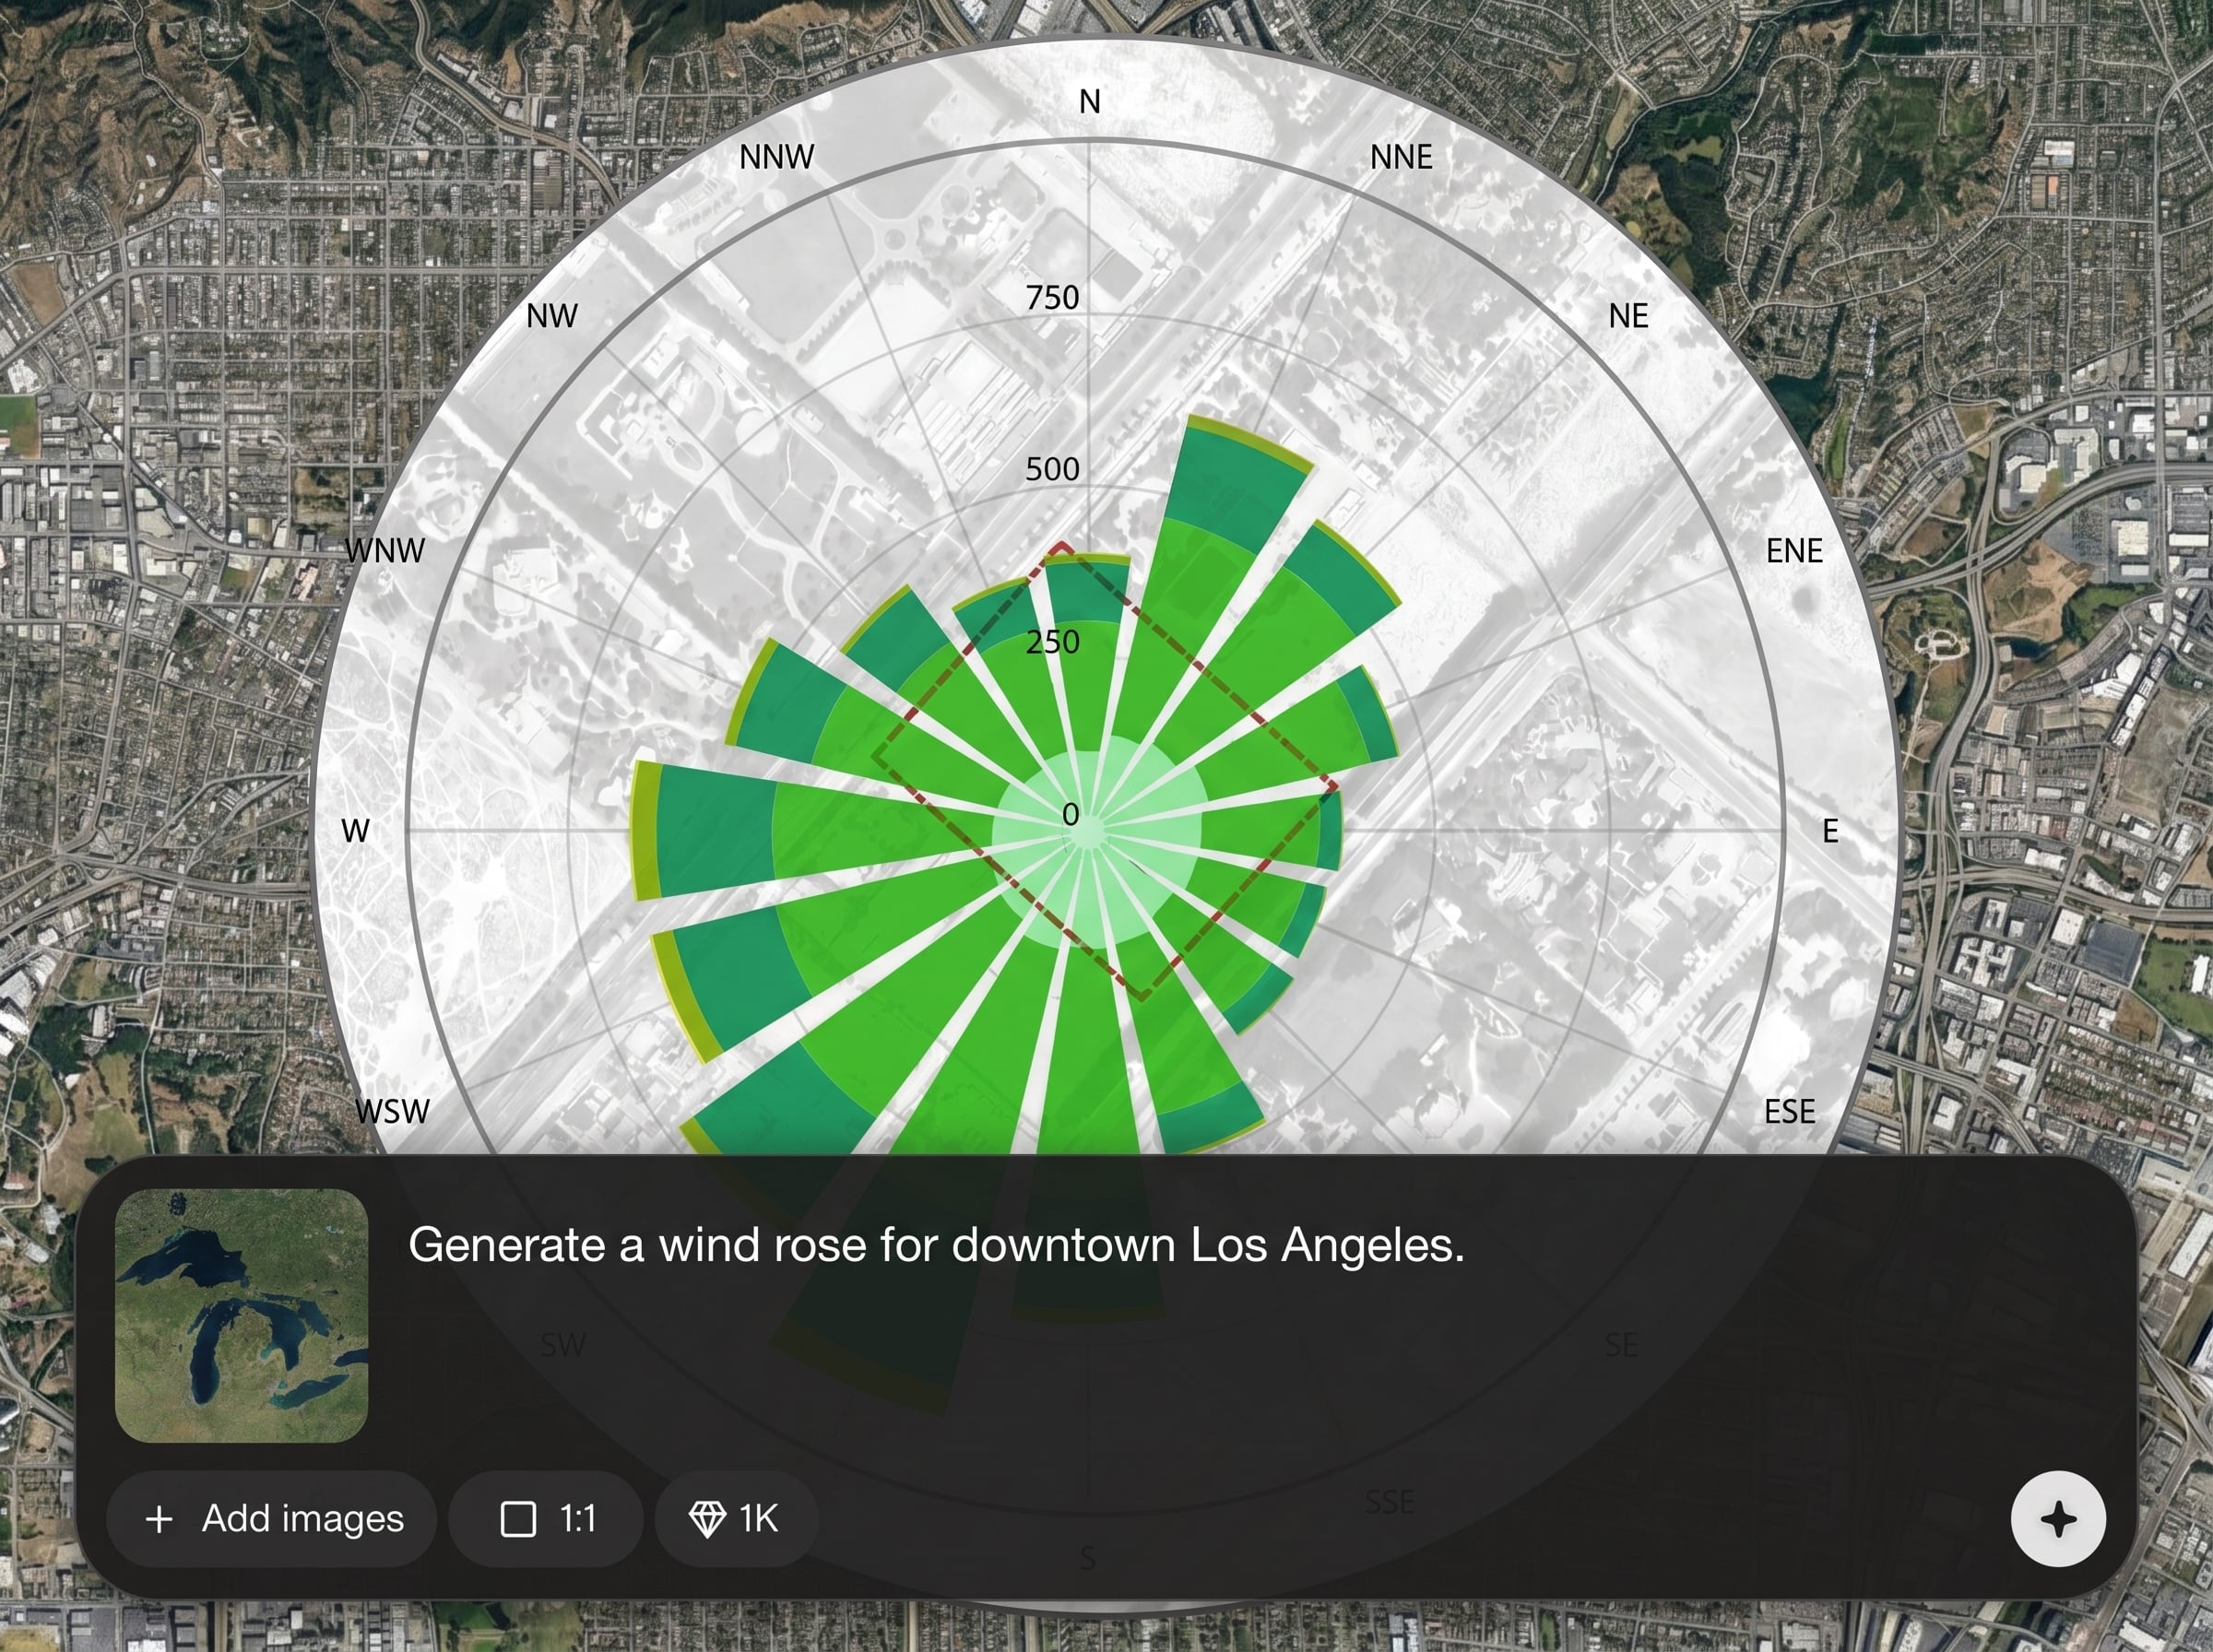
Use a simple Google Earth screenshot to provide visual site context. Pair imagery with analysis output to communicate wind insights clearly in reviews and reports.
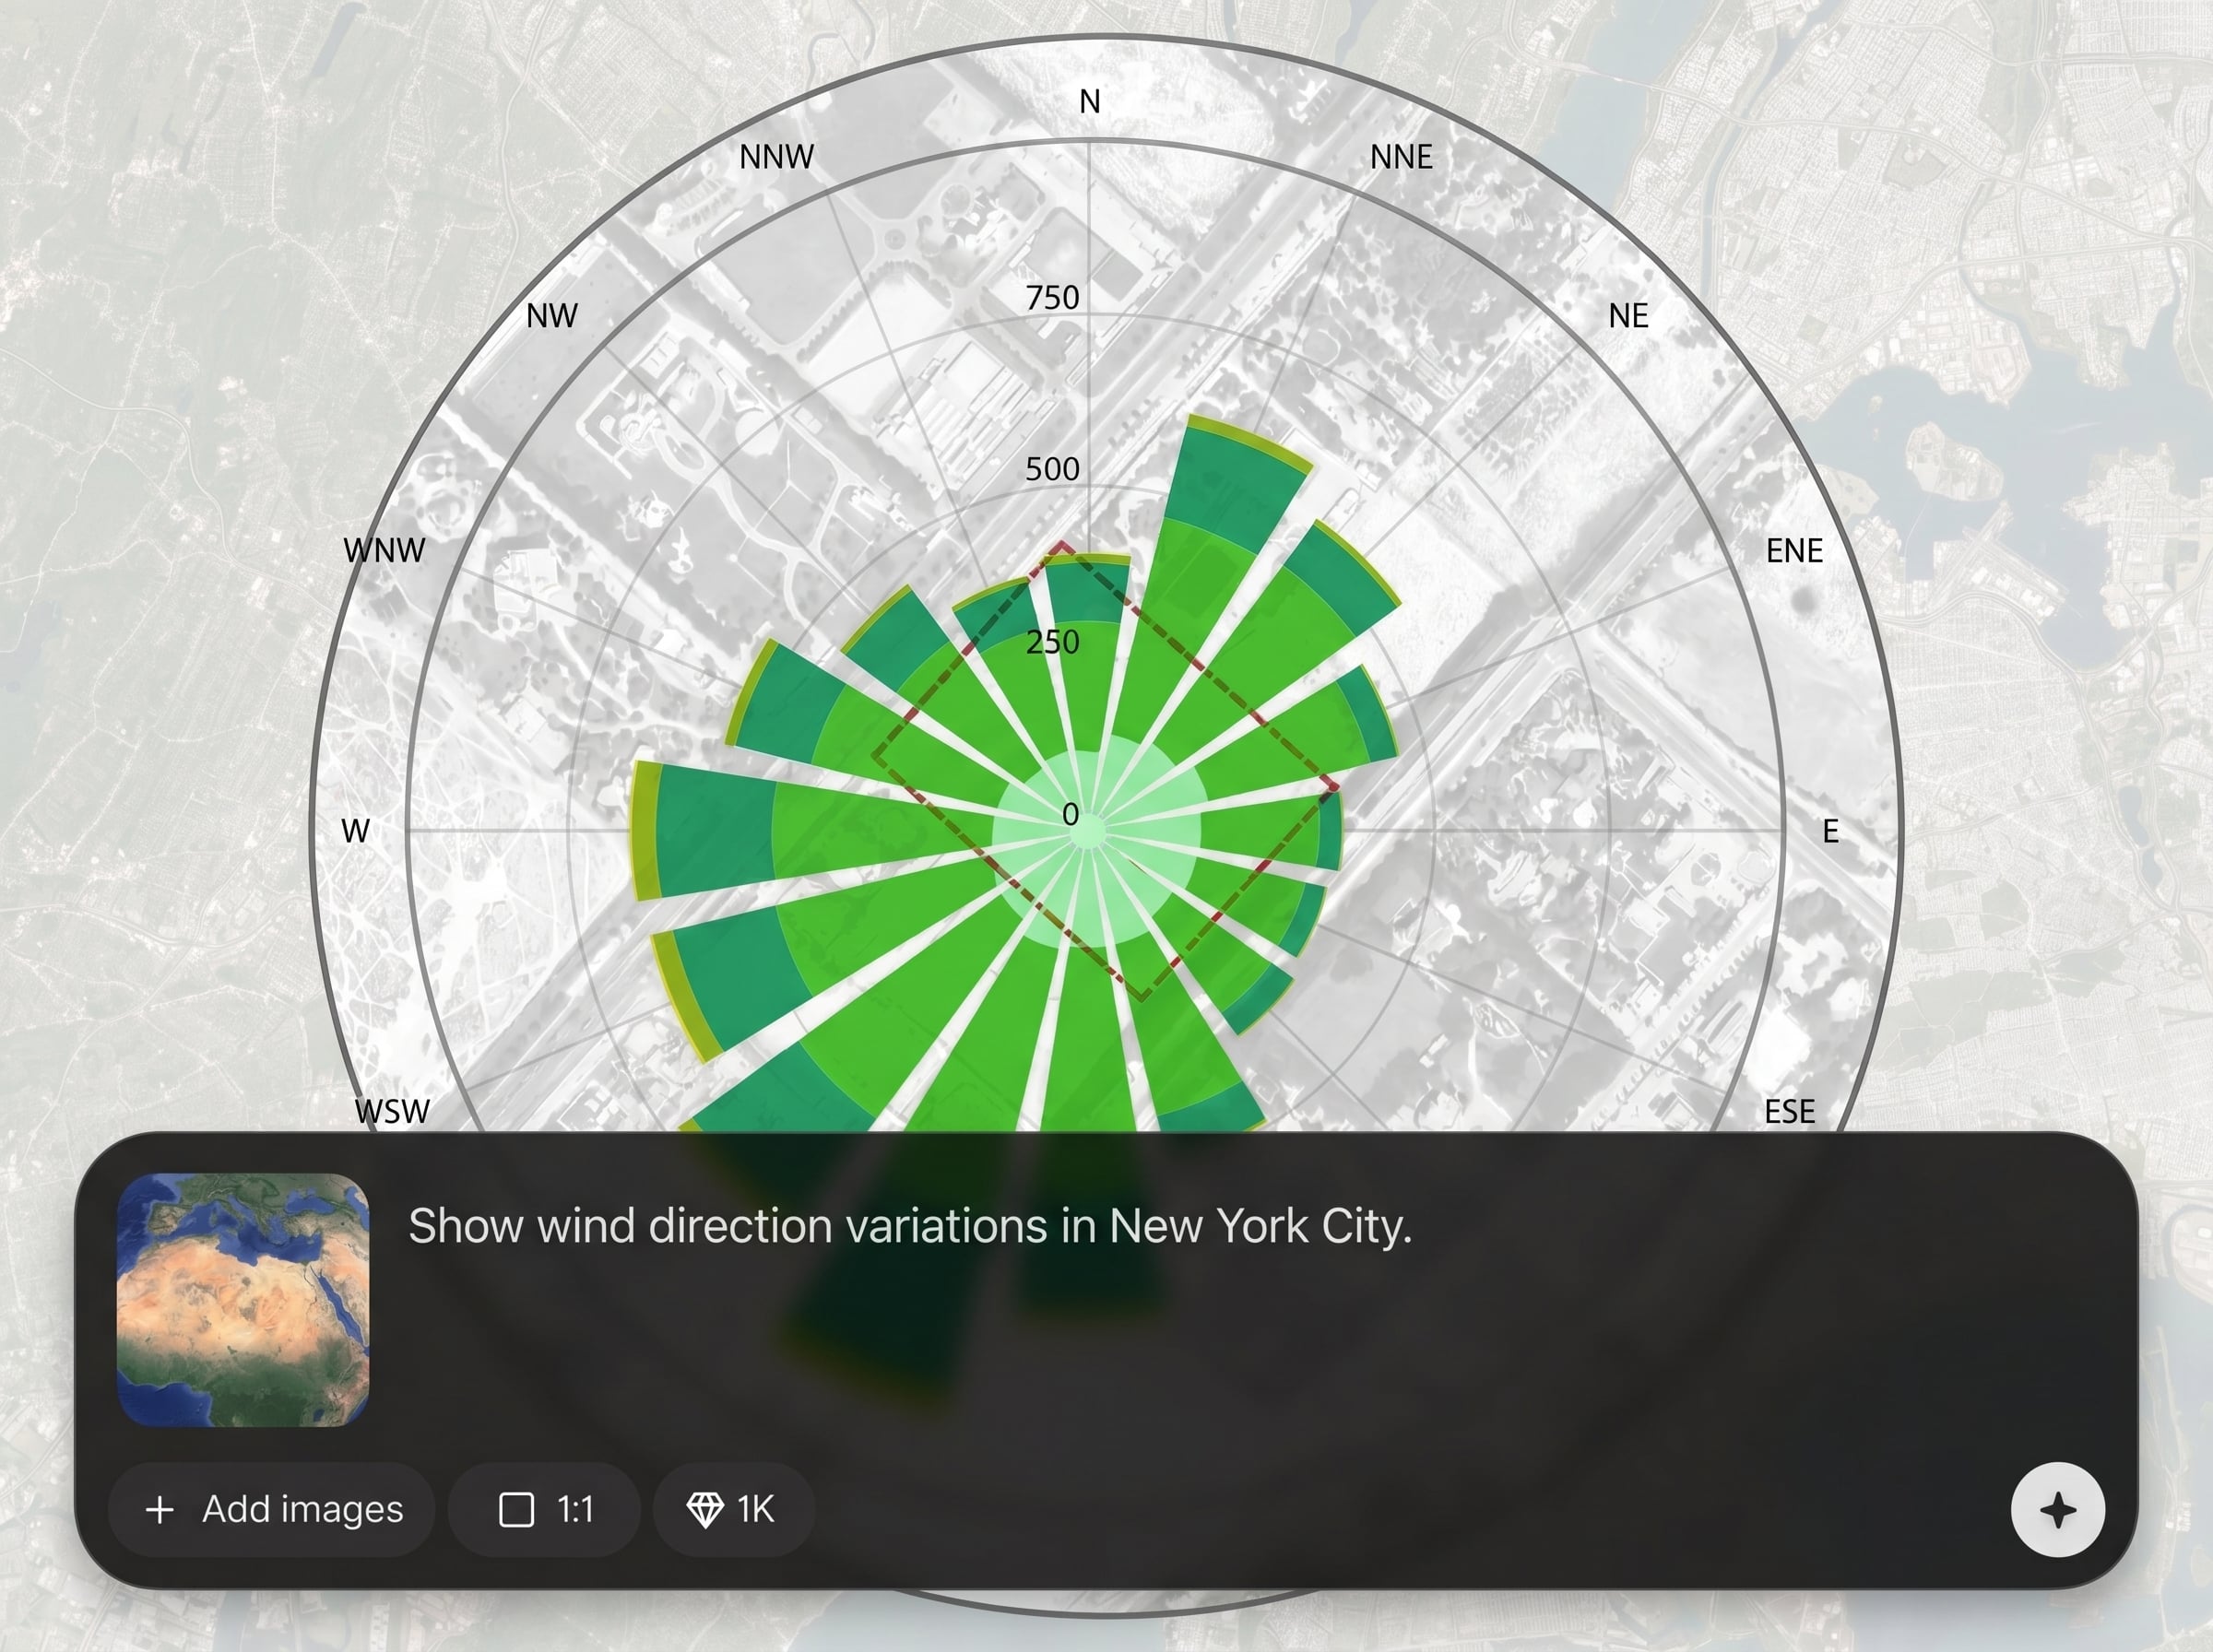
Generate results fast and iterate easily across multiple locations or viewpoints. Keep diagrams consistent for comparison, documentation, and streamlined decision-making.
About
XA_Wind Rose Analysis Diagram turns a location and a Google Earth screenshot into a clear wind rose analysis diagram in minutes. Use AI-assisted processing to visualize prevailing wind direction and frequency for early site planning, design decisions, and documentation. Export a clean diagram that’s easy to share in reports and presentations.
XA_Wind Rose Analysis Diagram streamlines wind rose analysis into a simple, fast workflow. With location input plus Google Earth context, it produces clear, consistent diagrams that communicate wind direction patterns quickly. Ideal for early decisions, comparisons, and reporting without heavyweight tools.
Enter a location, upload a Google Earth screenshot, and run the analysis. Review the generated wind rose diagram, then export it for planning documents or presentations and iterate as needed.
Use cases
Discover how different creators use this app in their workflow.
Evaluate prevailing wind directions to support building orientation, entrance placement, and outdoor space layout during early-stage site planning.
Add a clean wind rose analysis diagram to reports and presentations to explain wind patterns and design rationale with clear visuals.
Run the same wind rose workflow across different sites or neighborhoods to compare wind exposure and inform location selection.
Krea is one of the world's leading generative AI platforms. See what others say.
Real reviews on TrustpilotSo many AI tools out there but I always come back to Krea. It's really the one AI platform that 'just works'.

FYN
Krea's interfaces are still the best in the industry. Everything looks and feels so clean and easy to use! Imo the easiest to use gen AI website.

Lynn
Ultra fast generations. Extremely simple to use. All the latest AI models.

Daniel
KREA is the only AI subscription I have right now besides ChatGPT.

Sophia M.
Answers to common questions about generating wind rose analysis diagrams with AI.
You only need a project location and a Google Earth screenshot. The tool uses these inputs to generate a wind rose analysis diagram you can review and export.
Accuracy depends on the provided location and the clarity of your screenshot. The app is designed for quick planning insights and communication, not as a replacement for detailed meteorological studies.
Yes. The output is formatted to be easy to share and embed in planning documents, design reviews, and environmental summaries. Generate multiple versions to document alternatives and iterations.
Use a clear, high-resolution screenshot with the site centered and minimal UI overlays. A consistent zoom level helps when comparing multiple wind rose analysis diagrams across scenarios.
Yes. Run the tool with different locations or new Google Earth screenshots to create comparable wind rose diagrams. This supports quick side-by-side evaluation for planning and design decisions.
Upload a Google Earth screenshot, set a location, and get a wind rose analysis diagram in minutes.